Spatial Transcriptomics
Methods that measure gene expression while preserving the locations and neighbourhoods of cells within tissue.
- Revision
- 1
- Created by
- SCIENDIA Knowledge Desk
- Updated by
- SCIENDIA Knowledge Desk
- Last updated
- 18.08.2026 12:20
Built by the community
Members can improve this article. Every saved change remains visible in the revision ledger.
Overview
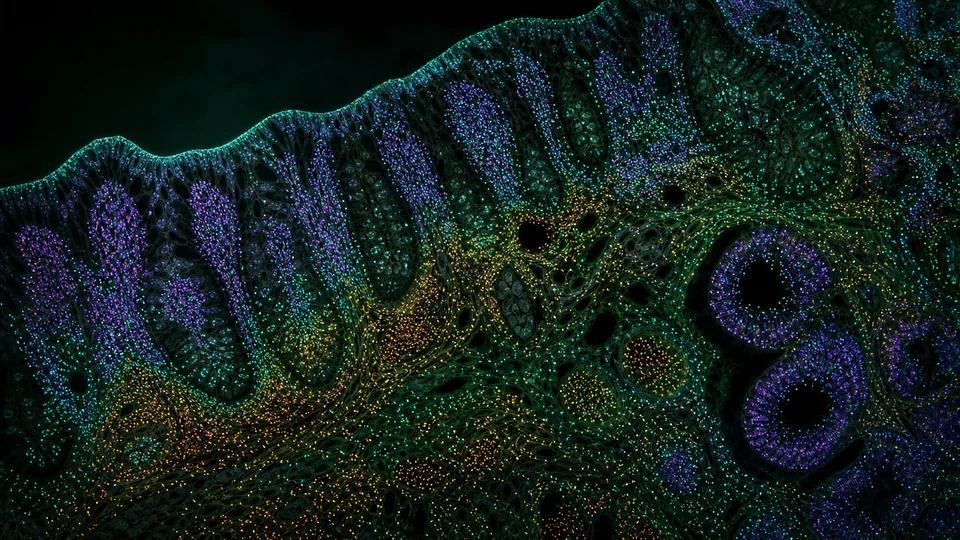
Spatial transcriptomics links molecular state to tissue architecture. Instead of dissociating a specimen into an unordered cell suspension, it maps RNA abundance to coordinates, revealing boundaries, niches and signalling relationships that depend on local organisation.
Technical foundations
Spatial assays fall into capture-based and imaging-based families. Barcoded arrays attach positional sequences to messenger-RNA-derived molecules before sequencing, while in-situ methods use rounds of fluorescent probes or local amplification to identify transcripts directly. Resolution ranges from multicellular spots to subcellular molecules, with trade-offs in gene breadth and field size. Computational deconvolution estimates cell-type mixtures, and spatial factor models identify expression domains while accounting for neighbouring observations that violate independence assumptions.
How it works
Tissue sections are captured on spatially barcoded substrates or interrogated by repeated imaging and in-situ hybridisation. Sequenced or imaged transcripts are assigned to locations, normalised and integrated with histology. Computational models segment cells, identify domains and test spatially varying expression.
Measurement and research methods
A rigorous workflow records tissue handling, ischemia time, section thickness and image registration. Histology guides quality control, and external RNA controls assess detection efficiency. Cell segmentation is benchmarked against manually reviewed regions because misplaced boundaries create false co-expression. Integration with single-cell references maps cell states but can miss novel populations absent from the reference. Spatial differential-expression tests need permutation or covariance models suited to autocorrelation. Replicates should be independent organisms or specimens, not thousands of coordinates from one section.
Key ideas
- Spatial resolution, transcript coverage and tissue area trade against one another.
- A capture spot may contain multiple cells and requires deconvolution.
- Neighbourhood association does not by itself demonstrate cell-cell signalling.
Current research frontier
The frontier combines spatial RNA, proteins, chromatin, metabolites and lineage information in the same or aligned sections. Three-dimensional atlases reconstruct organs across serial slices, and live-compatible reporters seek dynamics beyond fixed snapshots. Tumour studies map immune exclusion and treatment-resistant niches; developmental studies resolve signalling centres and trajectories. Open challenges include molecule-efficient whole-transcriptome imaging, cross-platform calibration and causal inference from neighbourhood. Perturbation, organoid reconstruction and functional assays remain necessary to show that a predicted ligand-receptor interaction changes cell behaviour.
Why it matters
The approach maps development, tumours, immune niches and organ pathology and helps researchers understand why cells with similar transcriptomes behave differently in distinct tissue environments.
Limits and open questions
RNA degradation, segmentation errors, batch effects and limited molecule capture distort maps. Statistical tests must account for spatial autocorrelation, and inferred cell interactions require protein, perturbation or functional validation.
Explore through connected concepts
This article is indexed with 20 technical tags. Select a tag to explore the Wiki by concept.
You may also explore
Recommended from the technical tags shared with this article.
Single-Cell RNA Sequencing
Methods that measure transcript abundance in individual cells to resolve heterogeneous biological populations.
Read article →